Visualisation
One of the most interesting things about the field in which I work is the sheer range of topics I get to work on. Not just on different platforms or in different languages, but the actual subject matter of the projects. The project I’ve just completed, again working with Eutechnyx, manage to exercise parts of my skillset that I haven’t had to use for a while. Sometimes, working in games, you find yourself working on ostensibly the same problems. Different skin, different IPs, different engine, but really it’s the same fundamental concepts and functions that you’re re-implementing in a new project.
So when you get challenging problems, it’s really quite refreshing, because you have to go back to first principles of analysis and visualisation techniques to solve them. Where you’re presented with an overwhelming amount of information, and you have to design and implement something which wrangles that raw data into something coherent. Where you have to figure out a way of presenting that information in a way that is visually compelling and conveys that information in a useful, concise form. They are fundamentally hard problems, sometimes solvable, sometimes not, and finding the right solutions, if they exist at all, takes a level of concentration somewhat higher than the usual required to bring our games to life.
This is the state of mind I’ve been in for the last few months. For confidentiality reasons I can’t say anything very much about the project itself (it’s not the lovely visualisation linked above of course), but I wanted to talk about the satisfying nature of developing visualisations in general.
Often when you’re developing code, your debugging tools are limited to logging and step-by-step debugging. But for complex data sets, especially those dealing with spatial data, it’s far more useful to display that data visually. The same is true for end users – a sequence of numbers means very little; a dumped spreadsheet of data, while accurate, doesn’t let you see shapes or patterns. Turn those numbers into 2D graphs, and you can discern patterns, noise and trends. But that still may not be enough. You can make a line graph of each component of a 3D position that changes over time, but in 2D those graphs make little sense. Allow it to be viewed in true 3D space however, and suddenly you can see the shapes. But a line covering every point that 3D position visited tells you nothing about how quickly it moved between those points. So you introduce animation over time, or colour, and suddenly the data makes sense. When writing processing code, a visual representation of the outputs lets you pick out flaws that would otherwise be hidden. Spikes where there should be smoothness, patterns where there should be only random noise, correlations that hint at relationships you didn’t realise existed.
Of course it isn’t as simple as layering in more and more information. With too much visual clutter, it becomes impossible to discern any useful patterns from the data. So knowledge of what data is important becomes vital; ways of filtering information to show only what is relevant allow you to show information where it is needed, and hide it when it is not.
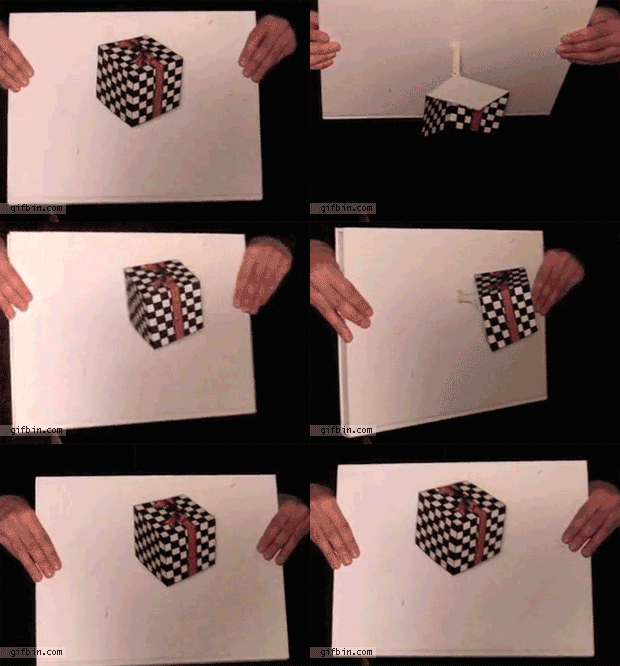
This, again, is one of the reasons why I’m so enthused about VR development. Being able to visualise spatial data is very dependent on good camera work – you have to be able to look around the visualisation. If the camera is out of your control, then you’re utterly reliant on the generated camera. If that is poor, then you might as well have a 2D visualisation of the data, because you need to have some useful spatial context to be able to process what you’re actually seeing. It’s for that reason that many optical illusions that rely on a particular perspective are defeated by moving your viewpoint; if you viewed the same illusion from a static perspective, you wouldn’t be able to tell it was an illusion at all.

Floating cube
So the introduction of VR allows us to get great flexibility of viewpoint, while not requiring the user to learn a cryptic set of control inputs to gain full 3D control over their viewpoint. That opens up great possibilities for exploring even more complex datasets and 3D structures. We’re living in an age where technology has advanced massively and the integration of computing into our everyday lives has resulted in masses of new information becoming available, in overwhelming amounts. Being able to visualise and process that information is the first step to being able to make use of it, and we’ll need new tools and tricks to do that.
